VB Reseller Analytics
2026 · Data & BI
- Role
- Creator and data analyst
- Outcome
- A 27-chart, 5-tab dashboard built from code
Summary
VB Reseller Analytics is a data analysis study of a distributor with 300 resellers. I built a sales dashboard with all the business rules in SQL.
- Problem: the sales team needs to know who will close the month below target, early enough to call first.
- What I did: I built the dashboard with PostgreSQL and Apache Superset. The business rules live in SQL, and the dashboard is built from code.
- Result: the dashboard has 27 charts in five tabs, one for each audience, and answers the sales team's five questions.
- Stack: PostgreSQL, Apache Superset and Docker.
- Background: a study of my own, inspired by a real case, with fictional data.
Full case
5 min read
Context
The distributor sells through a network of resellers, such as neighborhood stores, gas stations and supermarkets.
The network has four levels: division, region, sales rep portfolio and reseller.
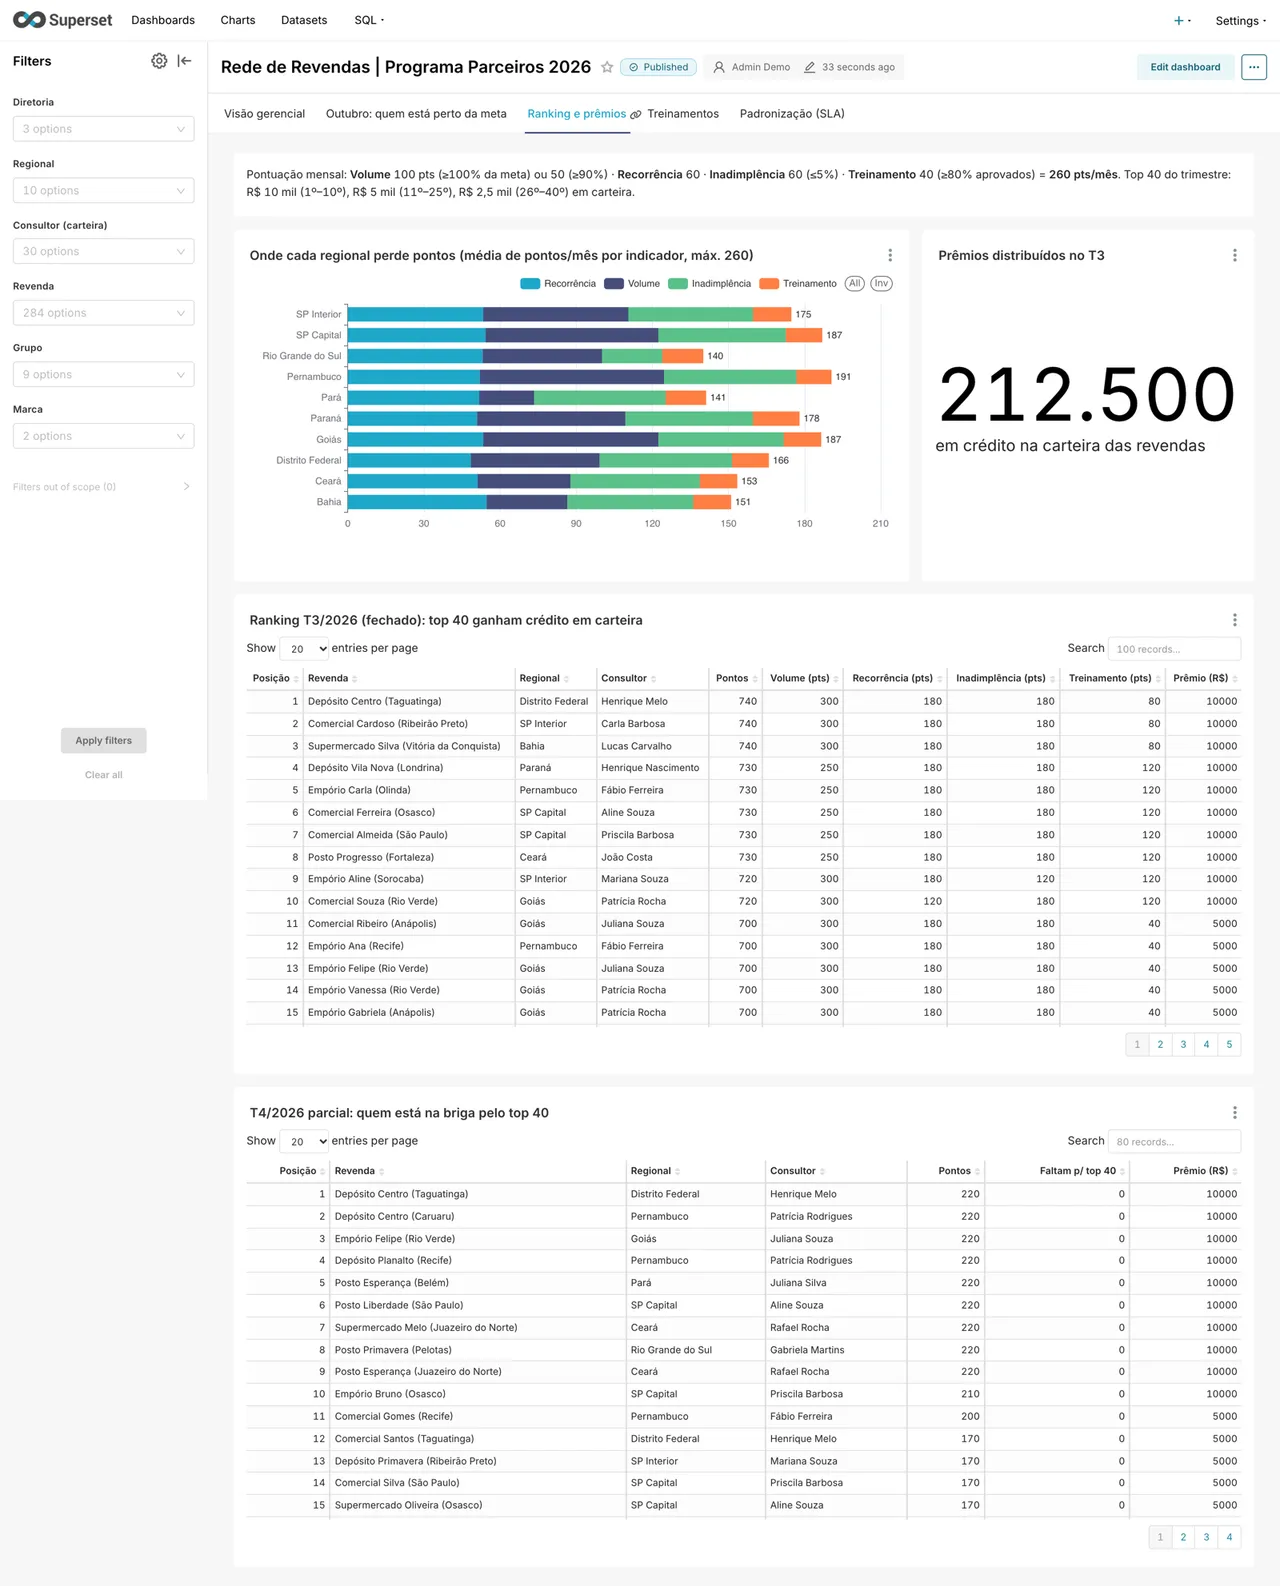
To keep the network engaged, the distributor runs a points program. Each reseller scores every month on four indicators:
- volume, with 100 points for hitting the target and 50 above 90%;
- order frequency, with 60 points;
- overdue payments up to 5% of the amount due, with 60 points;
- training, with 40 points when 80% of the staff pass.
The 40 resellers with the most points in the quarter earn credit of R$ 10k, R$ 5k or R$ 2.5k.
The sales team needs to answer five questions:
- Where the target is being missed, and whether the problem is volume, overdue payments or training.
- Who will close the month below target, early enough for the sales rep to call first.
- Where the ranking stands and who is close to the top 40.
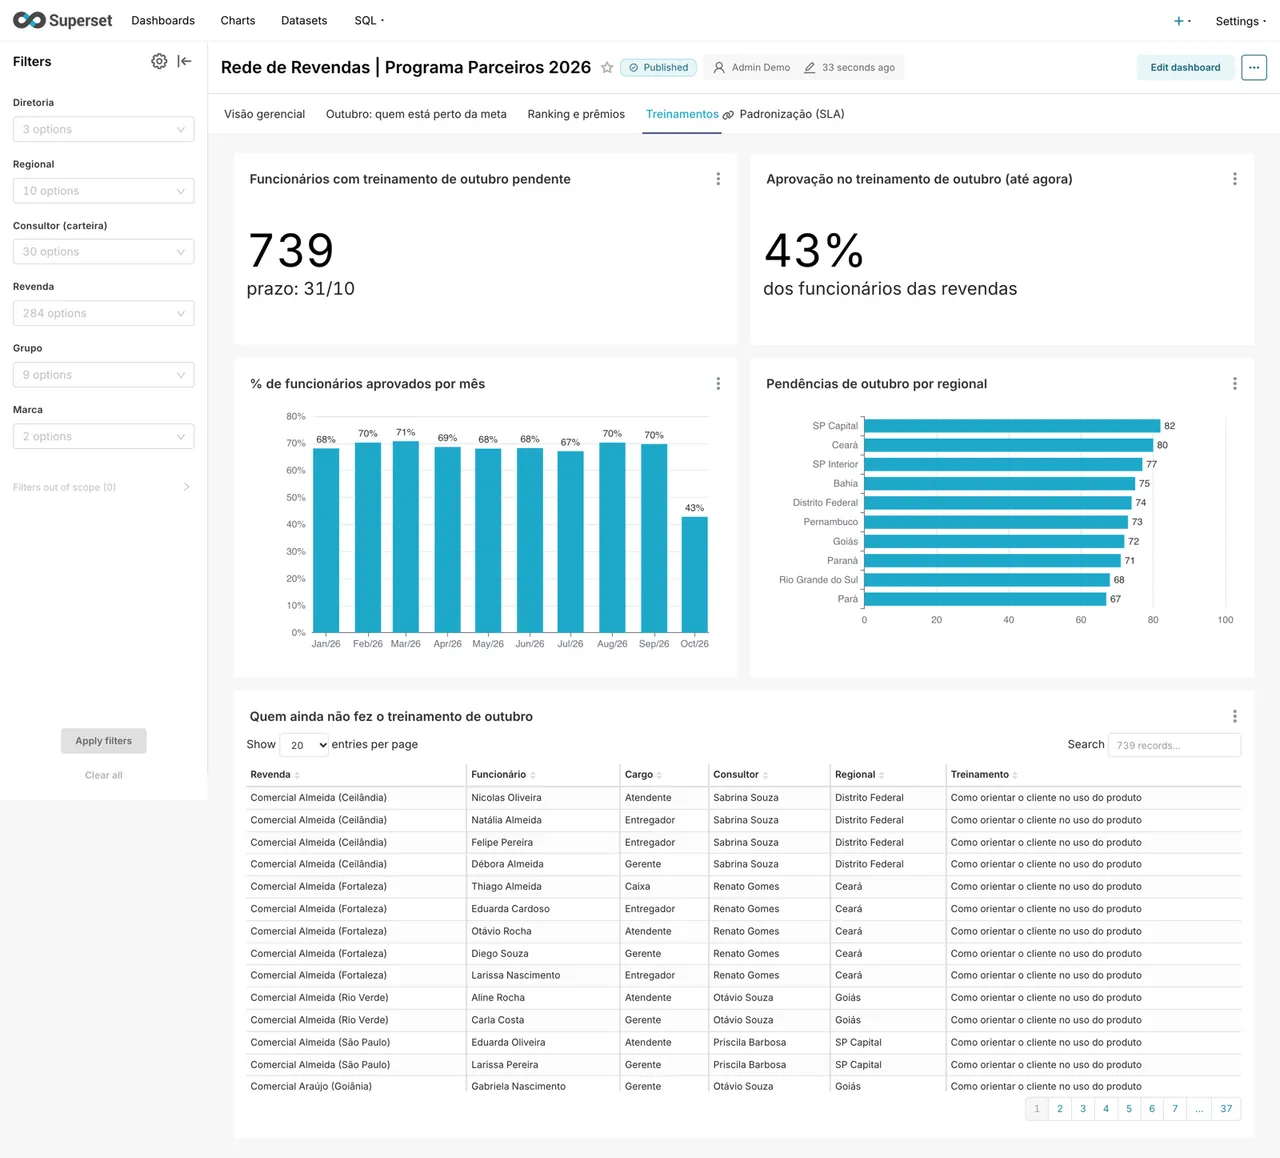
- Who hasn't taken this month's training yet.
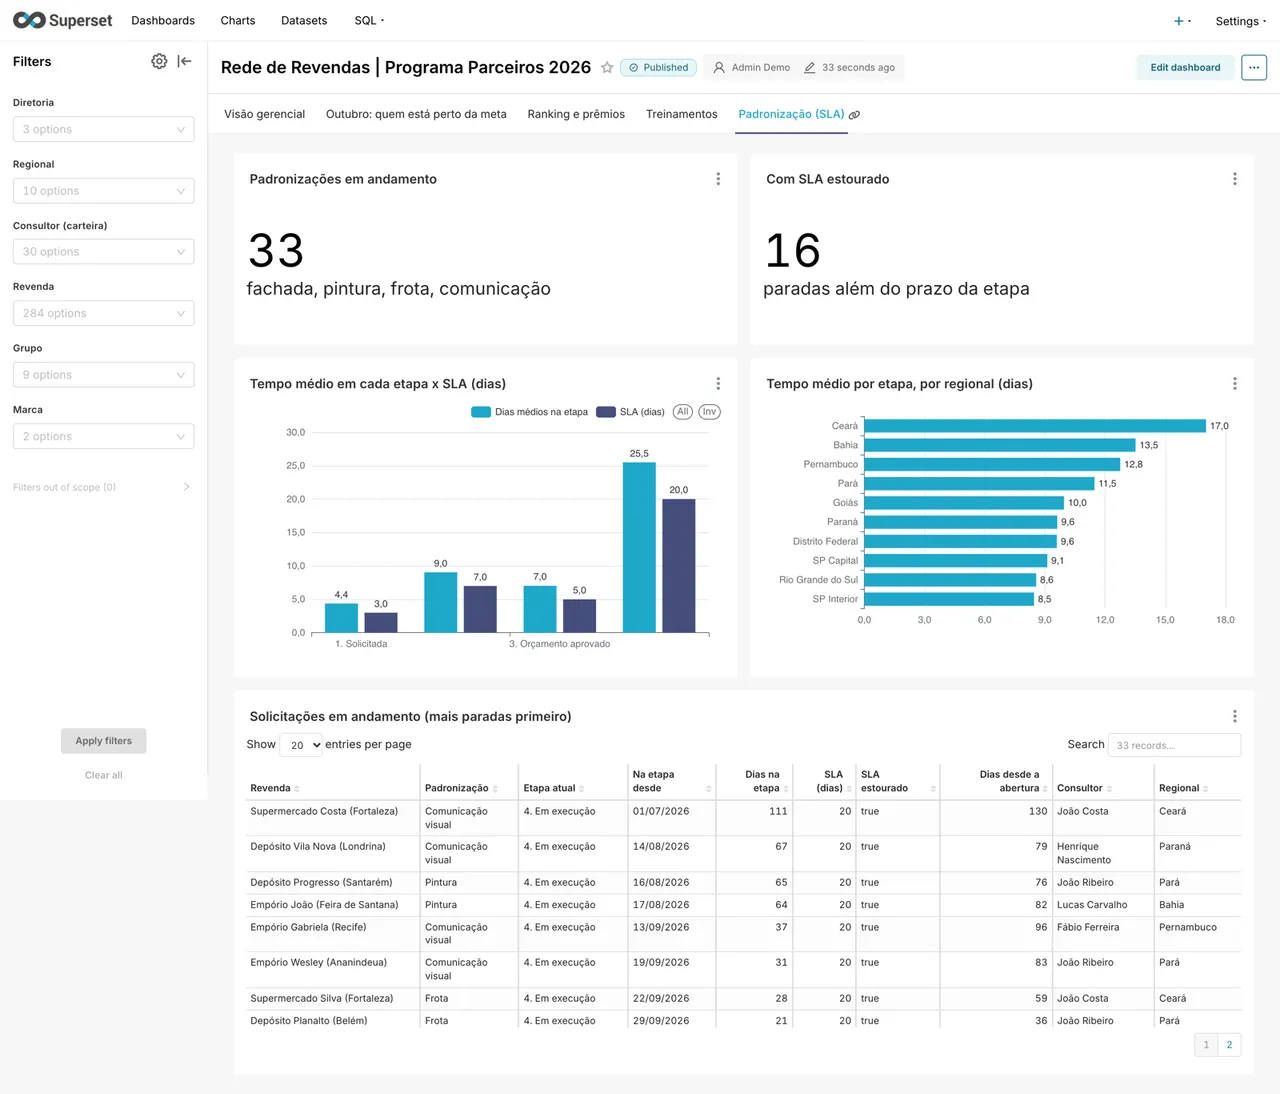
- Which store standardization jobs are stuck past their deadline.
I created the project to show how I answer this kind of question with SQL and BI. The data is fictional.
What I did
I built the analysis with PostgreSQL and Apache Superset, all running on Docker.
I started with the tables. They follow the shape they would have coming out of a sales system, with no indicator precomputed.
An analyst almost never gets data that is ready for a chart.
Then I created a data generator with intent. Each region has a profile, so the dashboard has something to show:
- Pará and Ceará sell well below target;
- Rio Grande do Sul has about 18% overdue payments, against about 3% in the rest of the network;
- the Northeast is slower on standardization jobs;
- training stays below 80% across the whole network.
That adds up to 300 resellers, about 18,000 orders and 11,000 training answers. The seed is fixed, so everyone who runs it sees the same numbers.
All the business rules live in SQL views, not in the charts. Superset only reads the result.
That way the rule is the same in every chart, in SQL Lab or in an export.
There are six views. The main one crosses reseller and month and computes the percentage of target, overdue payments, training and points.
The views use a reference date stored in the database instead of today's date. The numbers don't change on their own from one day to the next.
Last, the dashboard became code. A script creates the connection, the datasets, the 27 charts, the layout and the filters through the Superset API, with no clicking.
The dashboard is versioned in Git and rebuilt from scratch in seconds.
It has five tabs, each one for an audience:
- management overview, for the division and regional managers;
- who is close to target, for the sales rep;
- ranking and prizes, for everyone;
- training, for the sales rep and HR;
- standardization, for operations.
The filters cascade. The division narrows the regions, which narrow the sales reps and the resellers.
The ranking shows where each region loses points and who is in the race for the top 40.
The training tab lists who hasn't taken this month's training yet.
The standardization tab compares the time in each stage with its deadline and puts the most stuck jobs on top.
Detail
The sales rep's tab answers the most urgent question: who won't hit this month's target.
The forecast uses the sales pace up to the reference date. The sales rep sees the reseller at risk while there is still time to call.
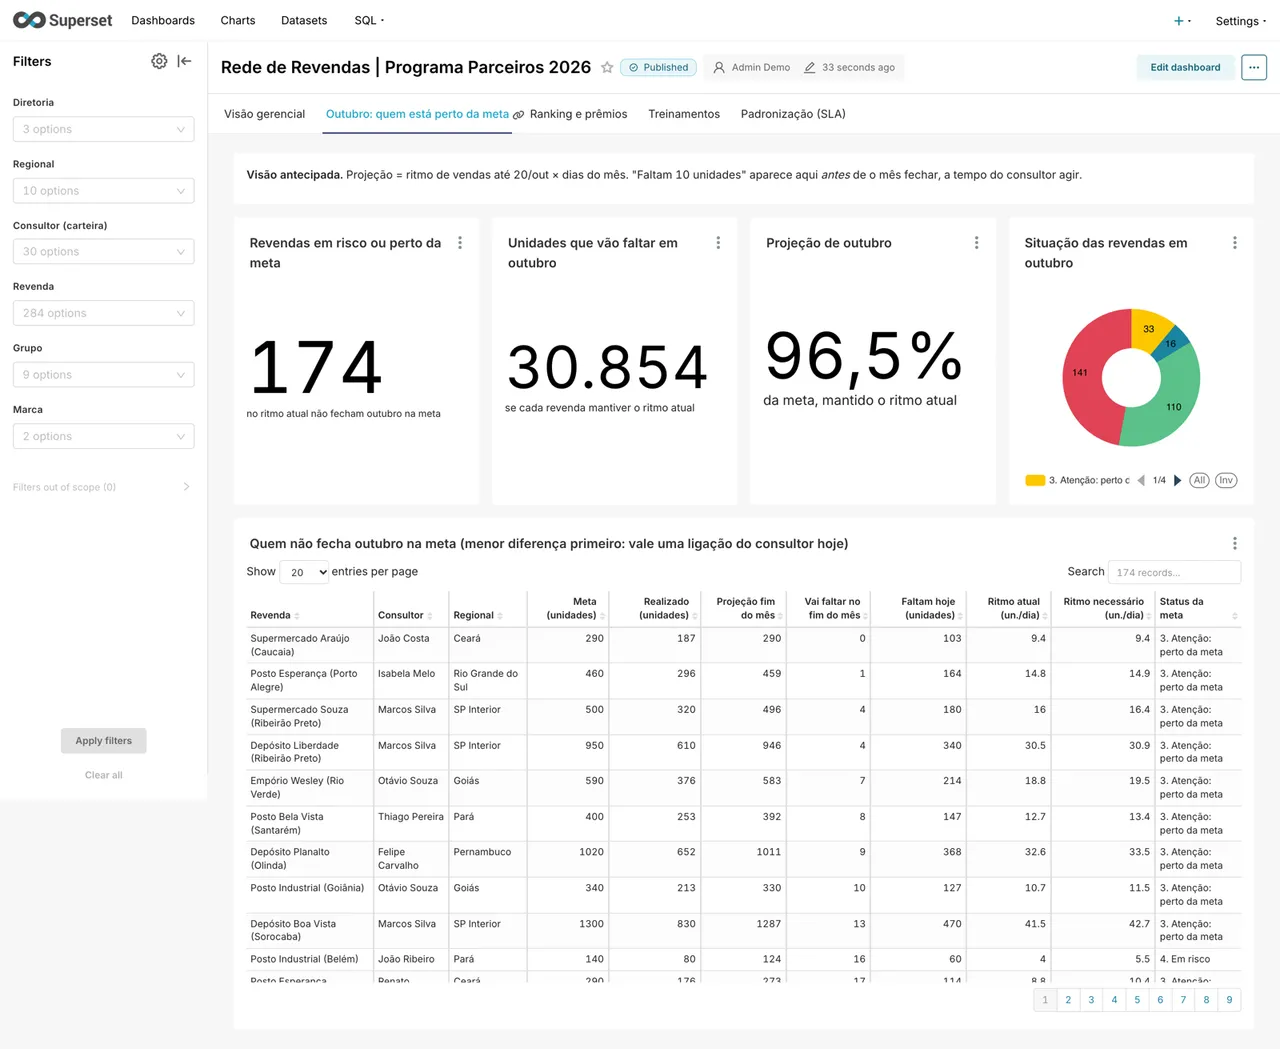
The list starts with those closest to the target, because there a call can still change the result.
I also answered seven ad hoc questions directly in SQL, outside the dashboard. One of them crossed training and sales.
The correlation came out close to zero in this data. So the dashboard doesn't promise that training raises sales.
Result
I published the project on GitHub in October 2026, with the code, the data and the steps to run it.
Anyone who clones the repository brings up the database and the dashboard with one Docker command.
The dashboard answers the sales team's five questions, in 27 charts and five tabs.
In a real deployment, the next step would be to give each sales rep access to their own portfolio only. Another would be to email the list of resellers at risk.
The project left a complete path, from the raw table to the dashboard, kept in code.